I’ve been interested for some time on figuring out an analytical way to determine what characterizes an NBA team as a playoff team. Looking at the previous six seasons, I pulled together almost 65 different statistics that characterize how a team plays, and then performed a classification tree analysis. I found the following result:
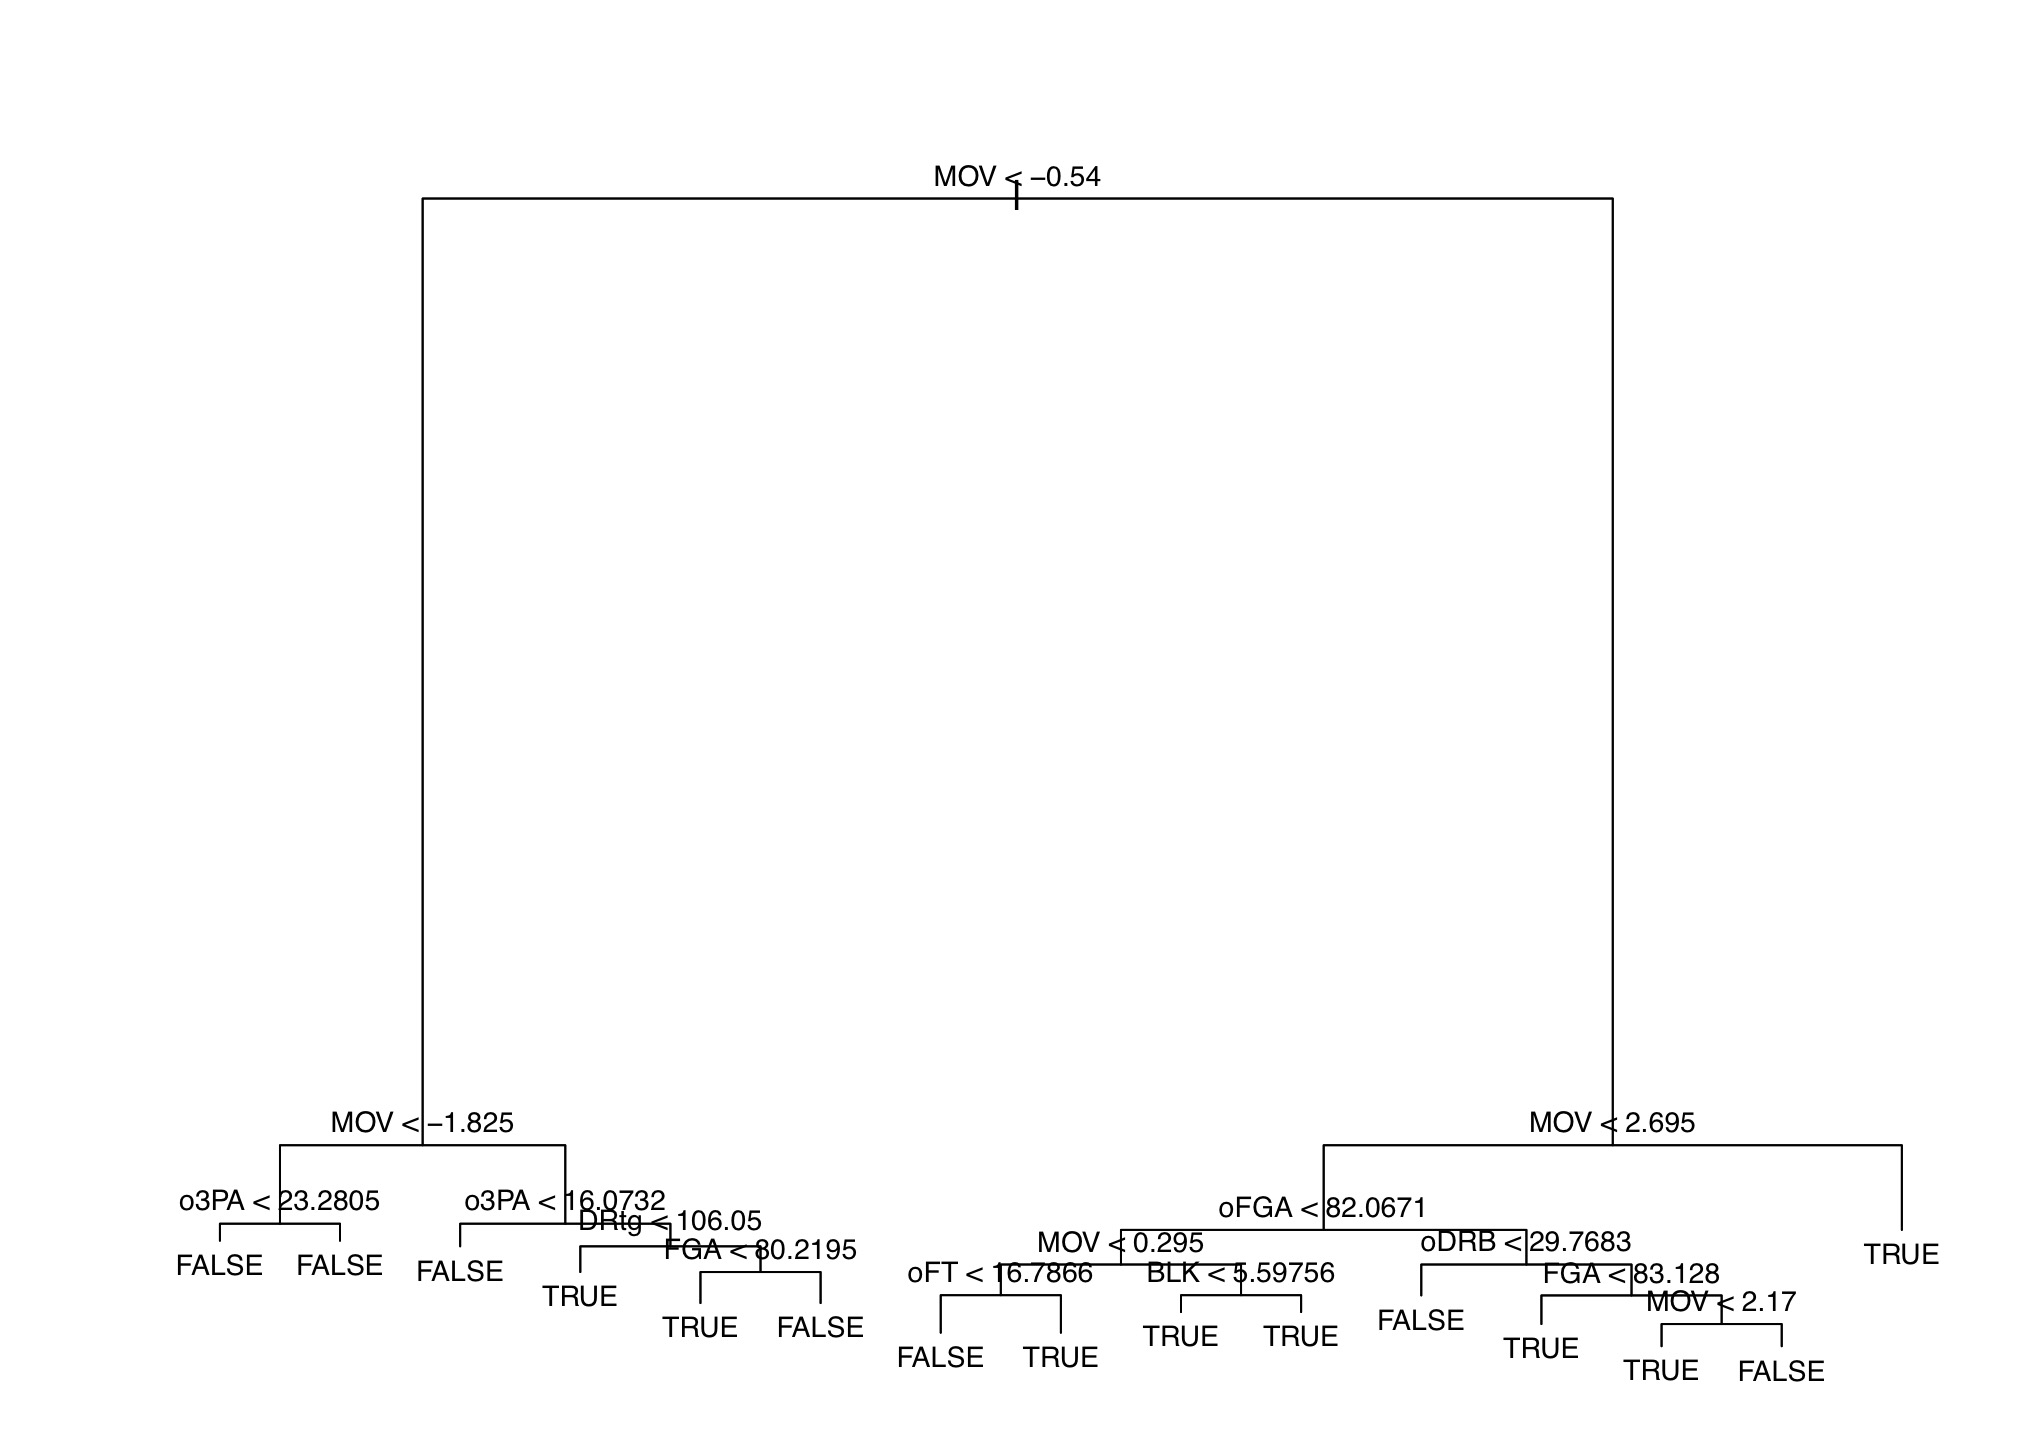
For the above tree, the misclassification error rate was 2.73%. Also, MOV stands for margin of victory, o3PA is the number of opponent three-point attempts per game, DRtg, is defensive rating, which is the number of points a team allows per 100 possessions, and so on. The data itself was taken from Basketball-Reference.com.
We see that the following patterns emerge among NBA playoff teams over the past number of seasons.
- MOV > 2.695
- MOV < -0.54, MOV > -1.825, Opponent 3PA > 16.0732, Defensive Rating < 106.05
- MOV < -0.54, MOV > -1.825, Opponent 3PA > 16.0732, Defensive Rating > 106.05, FGA < 80.2195
- MOV < 2.695, Opponent FGA < 82.0671, MOV < 0.295, Opponent FT > 16.7866
- MOV < 2.695, Opponent FGA < 82.0671, MOV > 0.295
- MOV < 2.695, Opponent FGA > 82.0671, Opponent DRB > 29.7683, FGA < 83.128
- MOV < 2.695, Opponent FGA > 82.0671, Opponent DRB > 29.7683, FGA < 83.128, MOV < 2.17

One reply on “What Do NBA Playoff Teams Have in Common?”
[…] However, in actuality, the Knicks were much closer to the playoffs than people realize. A previous post of mine described in detail using data science methodologies the criteria a team mus… […]