The Golden State Warriors have posed quite the conundrum for opposing teams. They are quick, have a spectacular ability to move the ball, and play suffocating defense. Given their play in the playoffs thus far, all of these points have been exemplified even more to the point where it seems that they are unbeatable.
I wanted to take somewhat of a simplified approach and see if opposing teams are missing something. That is, is their some weakness in their play that opposing teams can exploit, a “weakness in Helm’s deep”?
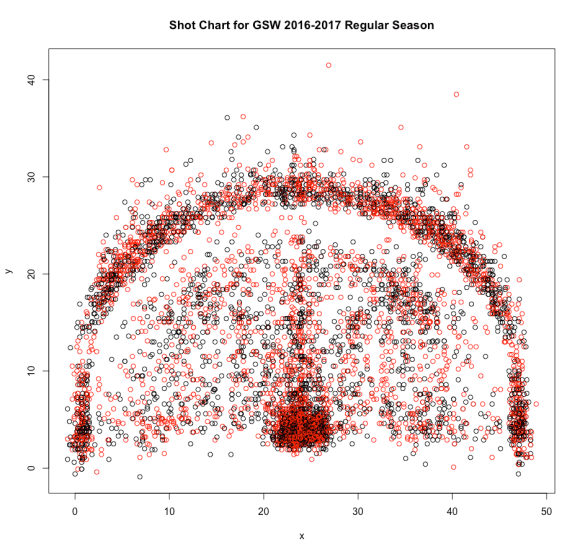
From here, I now extracted the x and y coordinates of each shot and recorded a response variable of “made” or “missed” in a table, such that the coordinates were now predictor variables and the shot classification (made/missed) was the response variable. Altogether, we had 7104 observations. Splitting this dataset up into a 70% training dataset and a 30% test data set, I tried the following algorithms, recording the % of correctly classified observations:
| Algorithm | % of Correctly Predicted Observations |
| Logistic Regression |
56.43 |
| Gradient Boosted Decision Trees |
62.62 |
| Random Forests |
58.54 |
| Neural Networks with Entropy Fitting |
62.47 |
| Naive Bayes Classification with Kernel Density Estimation |
57.32 |
One sees that that gradient boosted decision trees had the best performance correctly classifying 62.62% of the test observations. Given how noisy the data is, this is not bad, and much better than expected. I should also mention that these numbers were obtained after tuning these models using cross-validation for optimal parameters.
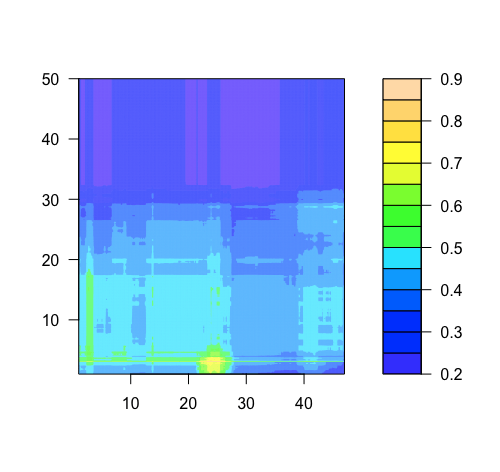
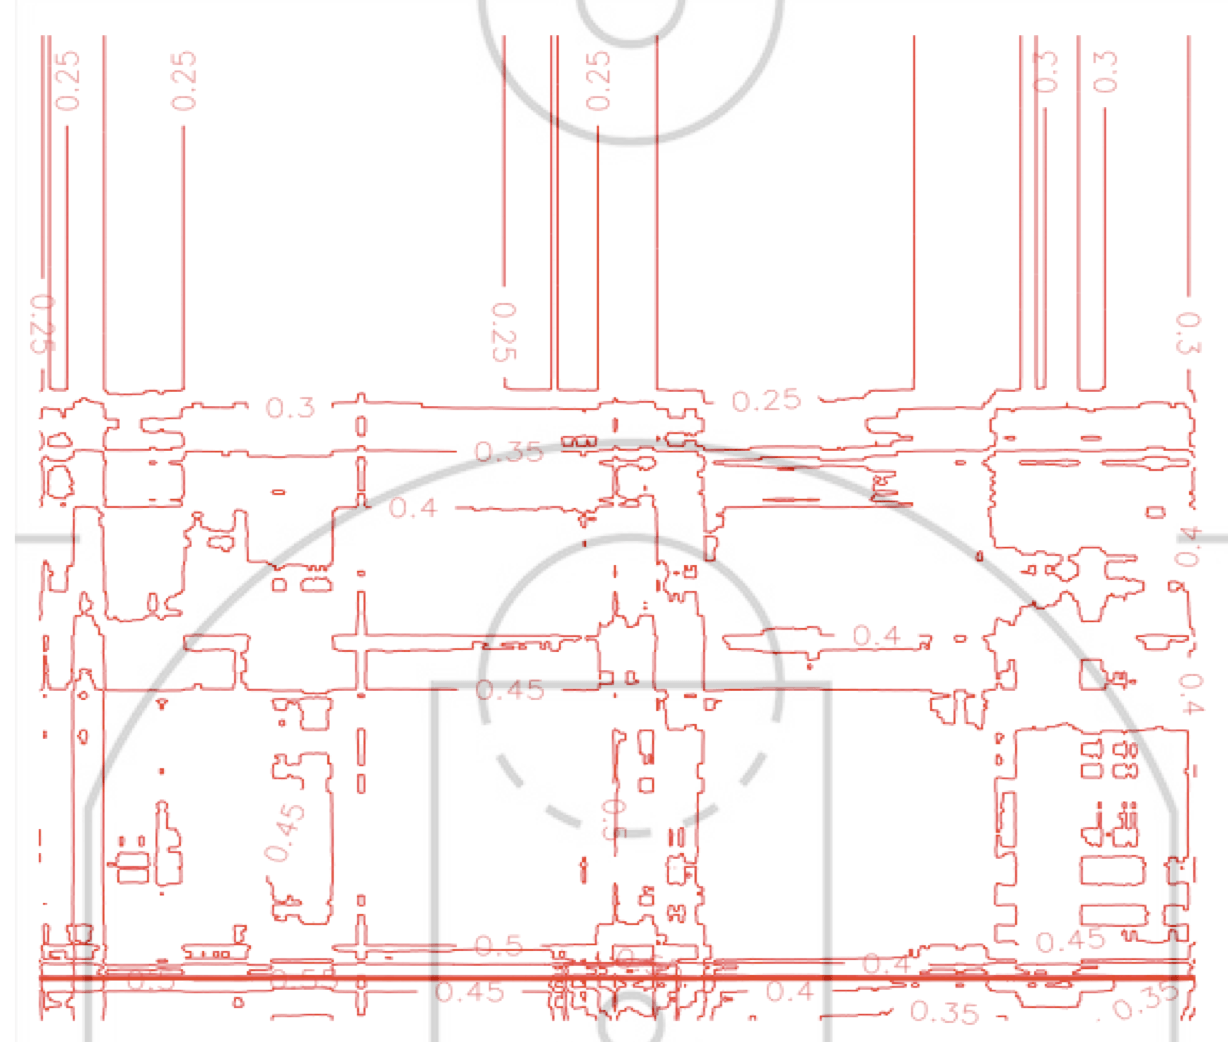
Using the gradient boosted decision tree model, we made a set of predictions for a vast number of (x,y)-coordinates for basketball court. We obtained the following contour plot:
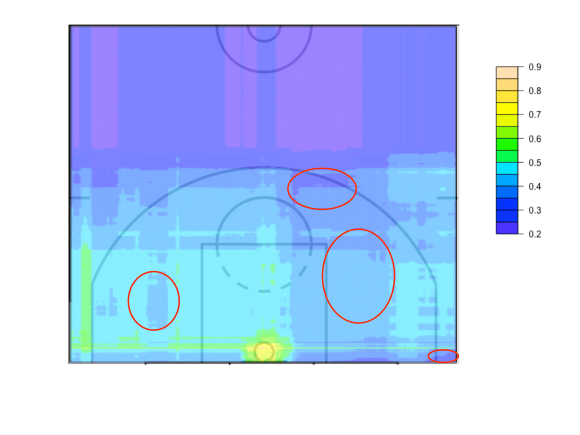
Overlaying this on top of the basketball court diagram, we got:

The contour plot levels denote the probabilities that the GSW will make a shot from a given (x,y) location on the court. As a sanity check, the lowest probabilities seem to be close to the 1/2-court line and beyond the three-point line. The highest probabilities are surprisingly along very specific areas on the court: very close the basket, the line from the basket to the left corner, extending up slightly, and a very narrow line extending from the basket to the right corner. Interestingly, the probabilities are low on the right side of the basket, specifically:
A map showing the probabilities more explicitly is as follows (although, upon uploading it, I realized it is a bit harder to read, I will re-upload a clearer version soon!)
In conclusion, it seems that, at least according to a first look at the data, the Warriors do indeed have several “weak spots” in their offense that opponents should certainly look to exploit by designing defensive schemes that force them to take shots in the aforementioned low-probability zones. As for future improvements, I think it would be interesting to add as predictor variables things like geographic location, crowd sizes, team opponent strengths, etc… I will look into making these improvements in the near future.
