Using mathematics to analyze who is a “better” player
It seems that nowadays one cannot escape the never-ending debate of “Who is better? Michael Jordan or Lebron James?” The situation is made worse by organizations like ESPN that have endless debates on their various shows combined with releasing lists of their Top “X” players. Not to mention that such lists are logically flawed (as I have mentioned several times before in other posts) because it is simply improper to compare players from different eras and of different positions on a single list.
I therefore designed an algorithm to compare players across different eras by analyzing both Michael Jordan’s and Lebron James’ strengths and weaknesses and evolve these forward and backwards in time, thus answering the question: If Michael Jordan played in Lebron James’ era, how would he perform? Similarly, if Lebron James played in Michael Jordan’s era, how would he perform?
First, looking at the season-by-season data of all of the years Michael played for the Bulls (I omitted the 1994-1995 season when he played for less than 30 games), I used the concept of entropy/information gain as part of boosted regression trees to get variable importance measures that contributed most to Michael Jordan’s scoring:
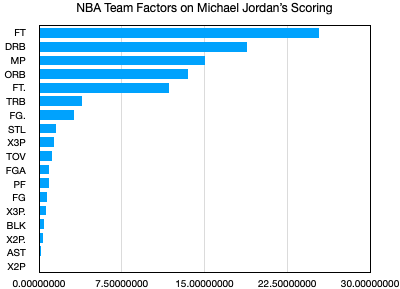
The above variable importance plot shows that the factors contributing most to Michael Jordan’s scoring were opponent free throws and opponent defensive rebounding.
We then took this regression model and evolved it forward in time to see what Michael Jordan’s scoring would like in the same era as Lebron James’s career (2003-2004 to 2018-2019), and obtained the following distribution:
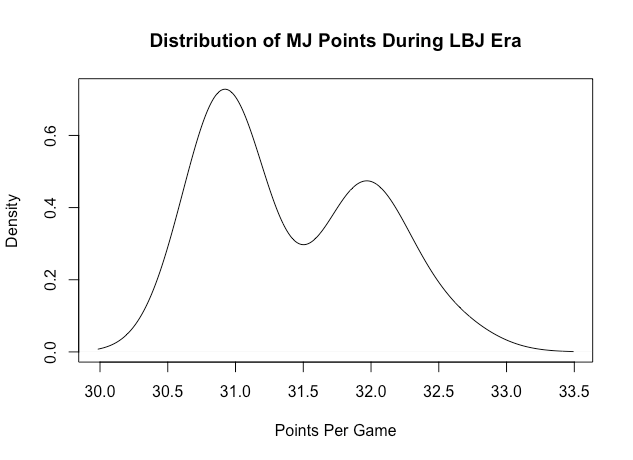
Using this probability density function, we calculate that Michael Jordan would be expected to score 30.92 points per game in a given season during the LBJ era. To put this in perspective, for the last 5 years, the top 5 scorers in the league have been:
2014-15 Season: 1. Westbrook (28.1), 2. Harden (27.4), 3. Lebron (25.3), 4. Anthony Davis (24.4), 5. DeMarcus Cousins (24.1), (MJ predicted 30.9 points per game would be #1)
2015-2016 Season: 1. Curry (30.1), 2. Harden (29.0), 3. Durant (28.2), 4. DeMarcus Cousins (26.9), 5. Lebron (25.3) (MJ predicted 30.9 points per game would be #1)
2016-2017 Season: 1. Westbrook (31.6), 2. Harden (29.1), 3. Thomas (28.9), 4. Davis (28.0), 5. DeRozan (27.3) (Here, MJ predicted 30.9 points per game would be slightly below Westbrook’s 31.6)
2017-2018 Season: 1. Harden (30.4), 2. Davis (28.1), 3. James (27.5), 4. Giannis (26.9), 5. Lillard (26.9) (MJ predicted 30.9 points per game would be #1)
2018-2019 Season: 1. Harden (36.1), 2. George (28.0), 3. Giannis (27.7), 4. Embiid (27.5), 5. Curry (27.3) (Here, MJ predicted 30.9 points per game would be #2 in league)
We therefore see that even in the “modern era”, MJ would be at the top of the league in scoring (#1 or #2). In the two instances where he is predicted to be #2, both Westbrook and Harden had remarkable scoring seasons, which is worth noting.
Now, we do the same for Lebron James. The first thing we did was look at Lebron’s season-by-season data, and analyze the opponent factors that contribute most to LBJ’s scoring:
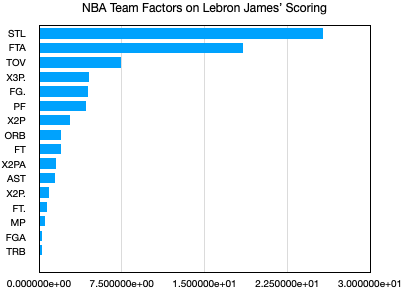
We see that Lebron James’ scoring is most heavily influenced by opponent steals, free throw attempts, and turnovers.
We now evolve this regression model into the past to obtain a scoring distribution during MJ’s era. We find the following:
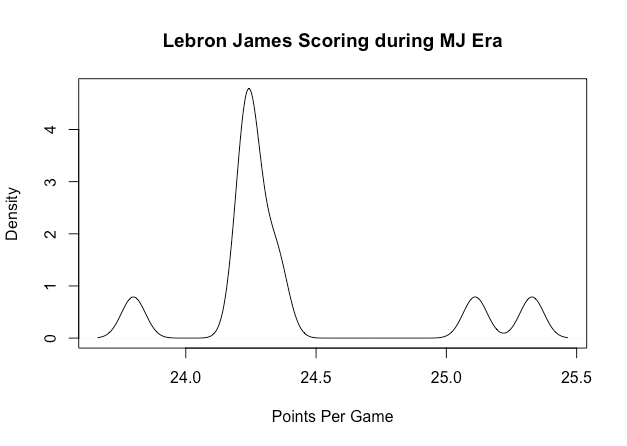
We find that the most we can expect Lebron to score in a given season during MJ’s era is 24.24 points per game. To put this into perspective, let’s look at the top 5 scorers from 1995-1998:
1995-1996 Season: 1. Jordan (30.4), 2. Olajuwon (26.9), 3. Shaq (26.6), 4. Malone (25.7), 5. Robinson (25.0). Here, LBJ’s predicted 24.24 points per game would not be in the top five.
1996-1997 Season: 1. Jordan (29.6), 2. Malone (27.4), 3. Rice (26.8), 4. Richmond (25.9), 5. Sprewell (24.2) Here, LBJ’s predicted 24.24 points per game would be just above or tied with Latrell Sprewell’s PPG.
1997-1998 Season: 1. Jordan (28.7), 2. Shaq (28.3), 3. Malone (27.0), 4. Richmond (23.2), 5. Walker (22.4). Here, LBJ’s predicted 24.24 points per game would rank fourth in the league above Richmond, but below Karl Malone.
Looking at LBJ’s predicted distribution above, we can also compare it with his actual scoring distribution from his career:
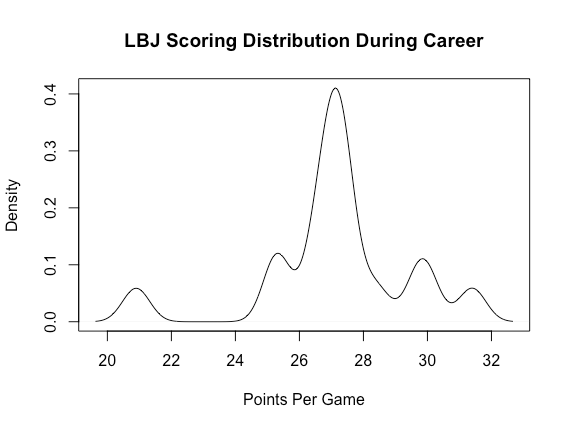
One sees that the predicted distribution in Figure 4 has a pronounced shift to the left, which implies that Lebron’s performance would be negatively effected if he played during MJ’s era.
