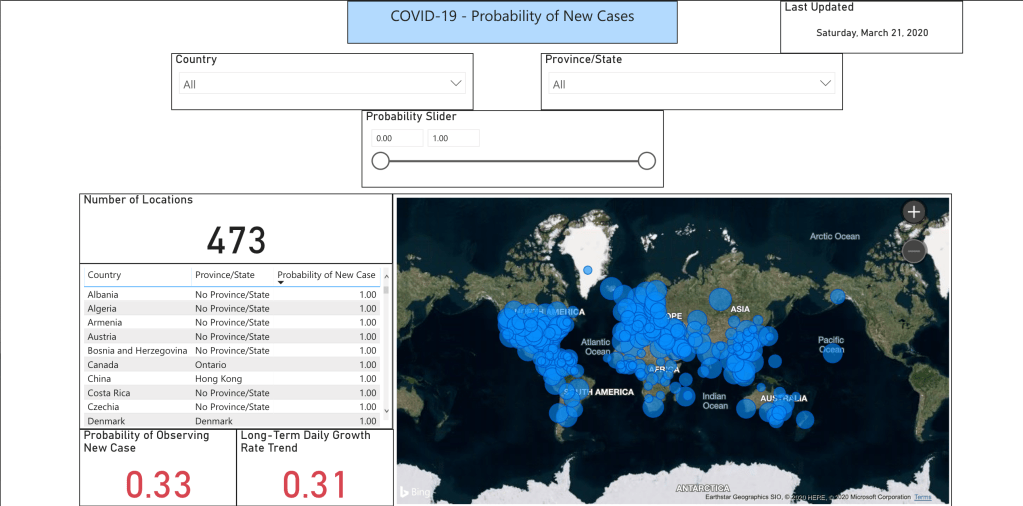
I wrote an extensive script in R that takes the most recent data available for the number of new/confirmed COVID-19 cases per day by location and computes the probability using statistical learning that a selected location will observe a new COVID-19 case (probability of observing a non-zero daily percentage return). You can access the dashboard by clicking the image below: (Beneath the screenshot are further examples of possible selections.)
Here, we see a map of all current COVID-19 locations, and an ability to select a specific location. Further, there are two calculations at the bottom of the screen: the first is the selected location(s) probability of observing a new case, the second is the current long-term trend of the daily growth rate of new cases for the selected location(s).
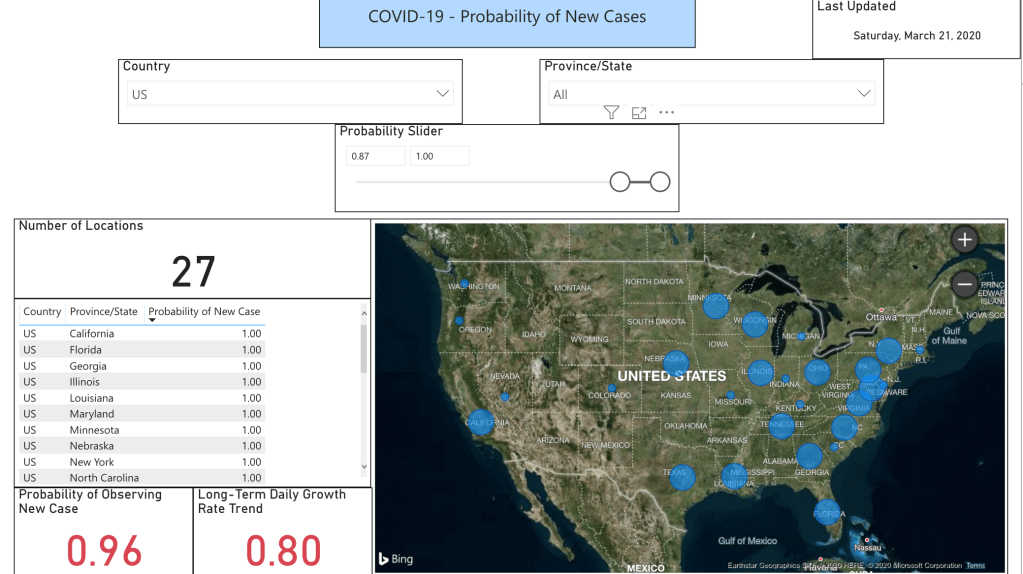
In this example, we have asked to return locations within the US that have more than an 87% probability of observing a new case. We can also see that for these locations, the long-term growth rate is trending towards 0.80.