Continuing with the live metrics employed yesterday, here is an analysis of the second half of the Warriors-Thunder Game 6.
Here is a plot of the various time series of relevant statistical variables:
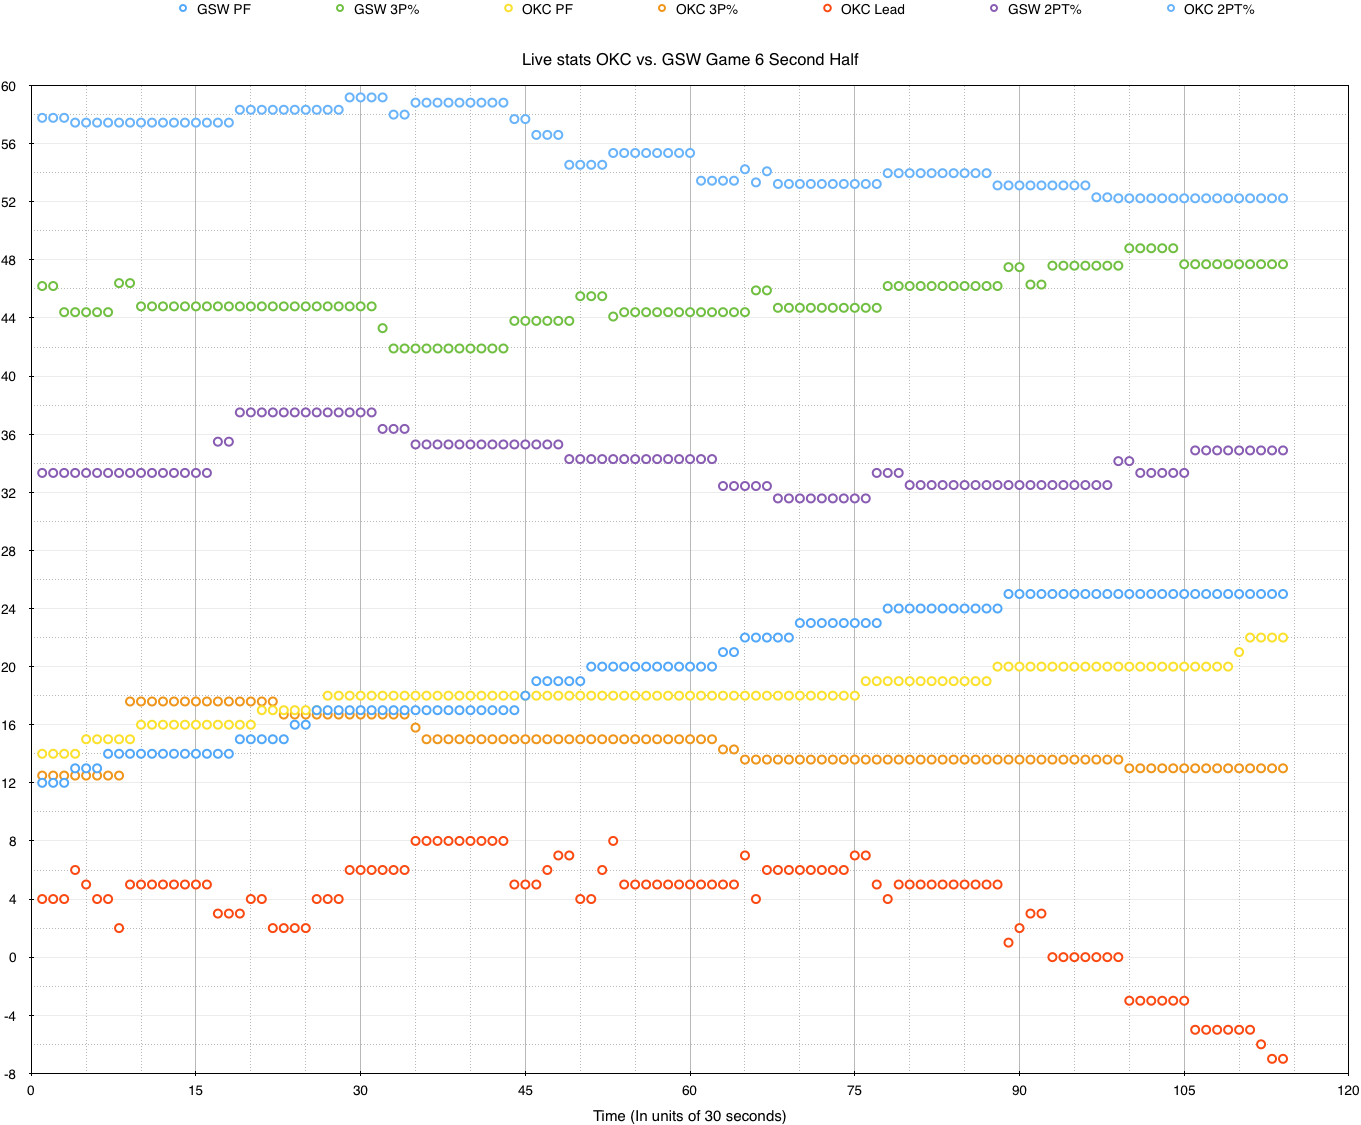
One can see from this plot for example, the exact point in time when OKC loses control of the game.
Further, here are the correlation coefficients of the variables above:

One sees there is a tremendously strong anti-correlation between OKC’s lead and GSW 3PT%, while there is a somewhat strong correlation between OKC’s lead and their 2PT%. This perhaps means that for Game 7, OKC’s 3PT defense needs to greatly improve along with maintaining their 2PT%, which, as can be seen from the plot above, dropped off towards the end of the game.
