In recent days, Donald Trump proposed yet another iteration of his immigration policy which is focused on “Keeping America Safe” as part of his plan to “Make America Great Again!”. In this latest iteration, in addition to suspending visas from countries with terrorist ties, he is also proposing introducing an ideological test for those entering the US. As you can see in the BBC article, he is also fond of holding up bar graphs of showing the number of refugees entering the US over a period of time, and somehow relates that to terrorist activities in the US, or at least, insinuates it.
Let’s look at the facts behind these proposals using the available data from 2005-2014. Specifically, we analyzed:
- The number of terrorist incidents per year from 2005-2014 from here (The Global Terrorism Database maintained by The University of Maryland)
- The Department of Homeland Security Yearbook of Immigration Statistics, available here . Specifically, we looked at Persons Obtaining Lawful Permanent Resident Status by Region and Country of Birth (2005-2014) and Refugee Arrivals by Region and Country of Nationality (2005-2014).
Given these datasets, we focused on countries/regions labeled as terrorist safe havens and state sponsors of terror based on the criteria outlined here .
We found the following.
First, looking at naturalized citizens, these computations yielded:
|
Country |
Correlations |
Percent of Variance Explained |
| Afghanistan |
0.61169 |
0.37416 |
| Egypt |
0.26597 |
0.07074 |
| Indonesia |
-0.66011 |
0.43574 |
| Iran |
-0.31944 |
0.10204 |
| Iraq |
0.26692 |
0.07125 |
| Lebanon |
-0.35645 |
0.12706 |
| Libya |
0.59748 |
0.35698 |
| Malaysia |
0.39481 |
0.15587 |
| Mali |
0.20195 |
0.04079 |
| Pakistan |
0.00513 |
0.00003 |
| Phillipines |
-0.79093 |
0.62557 |
| Somalia |
-0.40675 |
0.16544 |
| Syria |
0.62556 |
0.39132 |
| Yemen |
-0.11707 |
0.01371 |
In graphical form:

The highest correlations are 0.62556 and 0.61669 from Syria and Afghanistan respectively. The highest anti-correlations were from Indonesia and The Phillipines at -0.66011 and -0.79093 respectively. Certainly, none of the correlations exceed 0.65, which indicates that there could be some relationship between the number of naturalized citizens from these particular countries and the number of terrorist incidents, but, it is nowhere near conclusive. Further, looking at Syria, we see that the percentage of variance explained / coefficient of determination is 0.39132, which means that only about 39% of the variation in the number of terrorist incidents can be predicted from the relationship between where a naturalized citizen is born and the number of terrorist incidents in The United States.
Second, looking at refugees, these computations yielded:
| Country |
Correlations |
Percent of Variance Explained |
| Afghanistan |
0.59836 |
0.35803 |
| Egypt |
0.66657 |
0.44432 |
| Iran |
-0.29401 |
0.08644 |
| Iraq |
0.49295 |
0.24300 |
| Pakistan |
0.60343 |
0.36413 |
| Somalia |
0.14914 |
0.02224 |
| Syria |
0.56384 |
0.31792 |
| Yemen |
-0.35438 |
0.12558 |
| Other |
0.54109 |
0.29278 |
In graphical form:

We see that the highest correlations are from Egypt (0.6657), Pakistan (0.60343), and Afghanistan (0.59836). This indicates there is some mild correlation between refugees from these countries and the number of terrorist incidents in The United States, but it is nowhere near conclusive. Further, the coefficients of determination from Egypt and Syria are 0.44432 and 0.31792 respectively. This means that in the case of Syrian refugees for example, only 31.792% of the variation in terrorist incidents in the United States can be predicted from the relationship between a refugee’s country of origin and the number of terrorist incidents in The United States.
In conclusion, it is therefore unlikely that Donald Trump’s proposals would do anything to significantly curb the number of terrorist incidents in The United States. Further, repeatedly showing pictures like this:
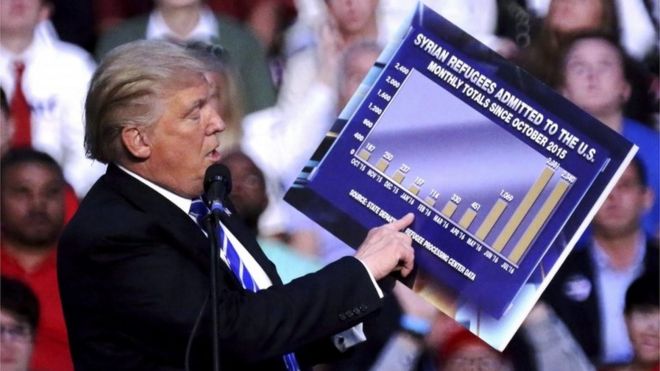
at his rallies is doing nothing to address the issue at hand and is perhaps only serving as yet another fear tactic as has become all too common in his campaign thus far.
(Thanks to Hargun Singh Kohli, Honours B.A., LL.B. for the initial data mining and processing of the various datasets listed above.)
Note, further to the results of this article, I was recently made aware of this excellent article from The WSJ, which I have summarized below:

