I was thinking about how one can use the NBA’s new SportVU system to figure out optimal positions for players on the court. One of the interesting things about the SportVU system is that it tracks player 


One can then use a logistic regression to determine the probability that a player at position
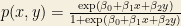
The main idea is that the parameters 
As a coaching staff from an offensive perspective, let us say we wish to position players as to say they have a very high probability of making a shot, let us say, for demonstration purposes 99%. This means we must solve the optimization problem:
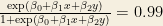

(The constraints are determined here by the x-y dimensions of a standard NBA court).
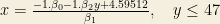
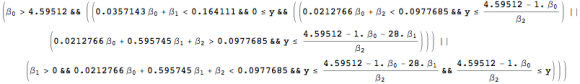
This has the following solutions:

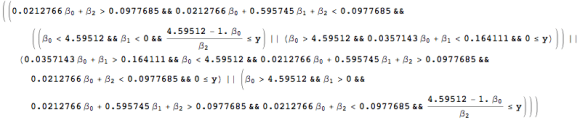
with the following conditions:

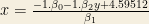
One can also have:
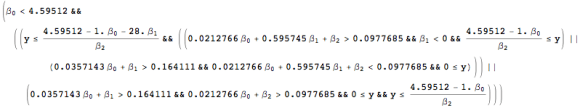
with the following conditions:
Another solution is:
with the following conditions:
The fourth possible solution is:
with the following conditions:
In practice, it should be noted, that it is typically unlikely to have a player that has a 99% probability of making a shot.
To put this example in more practical terms, I generated some random data (1000 points) for a player in terms of
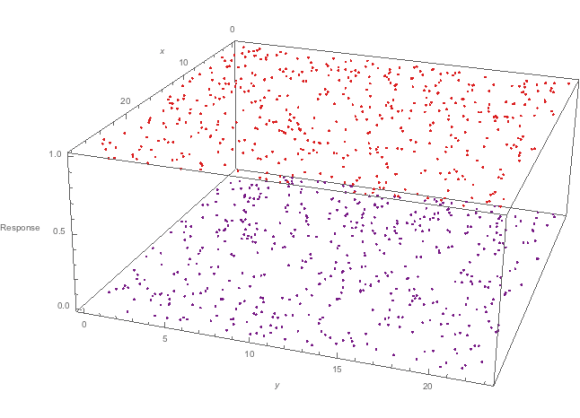
In this plot, the red dots indicate a player has made a shot (a response of 1.0) from the
Performing a logistic regression on this data, we obtain that 
Using the equations above, we see that this player has a maximum probability of