Where is Lebron James most effective on the court?
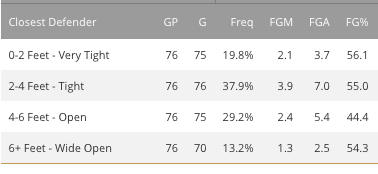
Based on 2015-2016 data, we obtained from NBA.com the following data which tracks Lebron’s FG% based on defender distance:
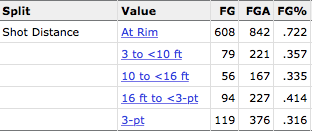
From Basketball-Reference.com, we then obtained data of Lebron’s FG% based on his shot distance from the basket:
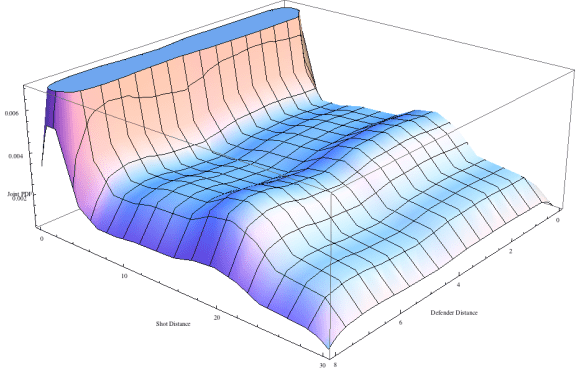
Based on this data, we generated tens of thousands of sample data points to perform a Monte Carlo simulation to obtain relevant probability density functions. We found that the joint PDF was a very lengthy expression(!):
Graphically, this was:
A contour plot of the joint PDF was computed to be:
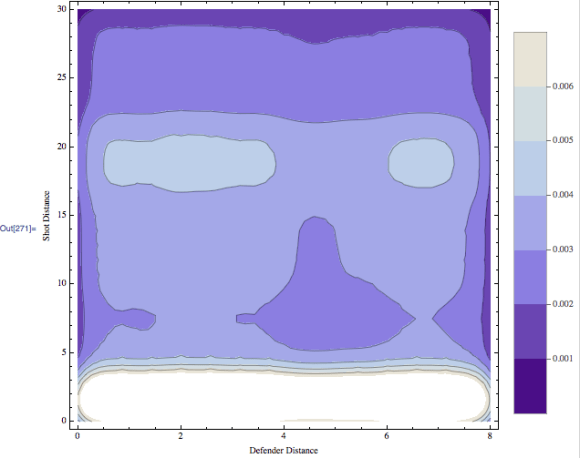
From this information, we can compute where/when LeBron has the highest probability of making a shot. Numerically, we found that the maximum probability occurs when Lebron’s defender is 0.829988 feet away, while Lebron is 1.59378 feet away from the basket. What is interesting is that this analysis shows that defending Lebron tightly doesn’t seem to be an effective strategy if his shot distance is within 5 feet of the basket. It is only an effective strategy further than 5 feet away from the basket. Therefore, opposing teams have the best chance at stopping Lebron from scoring by playing him tightly and forcing him as far away from the basket as possible.

One reply on “Analyzing Lebron James’ Offensive Play”
[…] a previous article, I showed how one could use data in combination with advanced probability techniques to determine […]