In this article, I will use Data Science / Machine Learning methodologies to break down the real factors separating the playoff from non-playoff teams. In particular, I used the data from Basketball-Reference.com to associate 44 predictor variables which each team: “FG” “FGA” “FG.” “X3P” “X3PA” “X3P.” “X2P” “X2PA” “X2P.” “FT” “FTA” “FT.” “ORB” “DRB” “TRB” “AST” “STL” “BLK” “TOV” “PF” “PTS” “PS.G” “oFG” “oFGA” “oFG.” “o3P” “o3PA” “o3P.” “o2P” “o2PA” “o2P.” “oFT” “oFTA” “oFT.” “oORB” “oDRB” “oTRB” “oAST” “oSTL” “oBLK” “oTOV” “oPF” “oPTS” “oPS.G”
, where a letter ‘o’ before the last 22 predictor variables indicates a defensive variable. (‘o’ stands for opponent. )
Using principal components analysis (PCA), I was able to project this 44-dimensional data set to a 5-D dimensional data set. That is, the first 5 principal components were found to explain 85% of the variance.
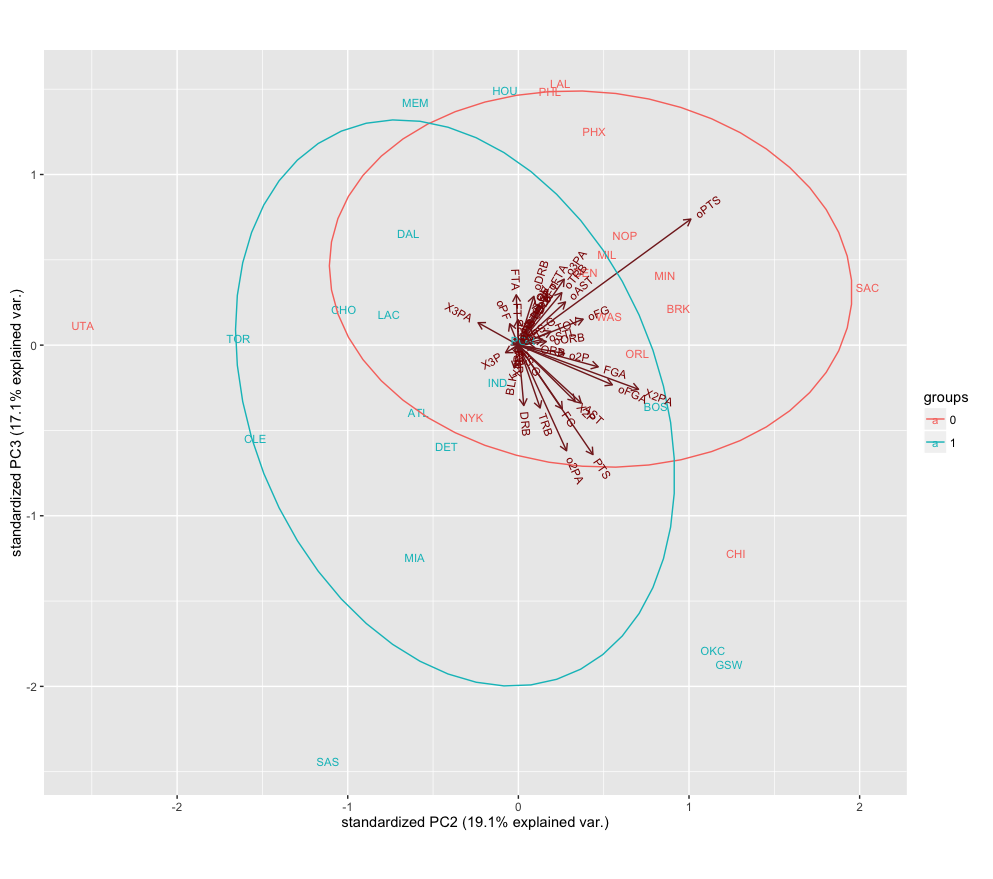
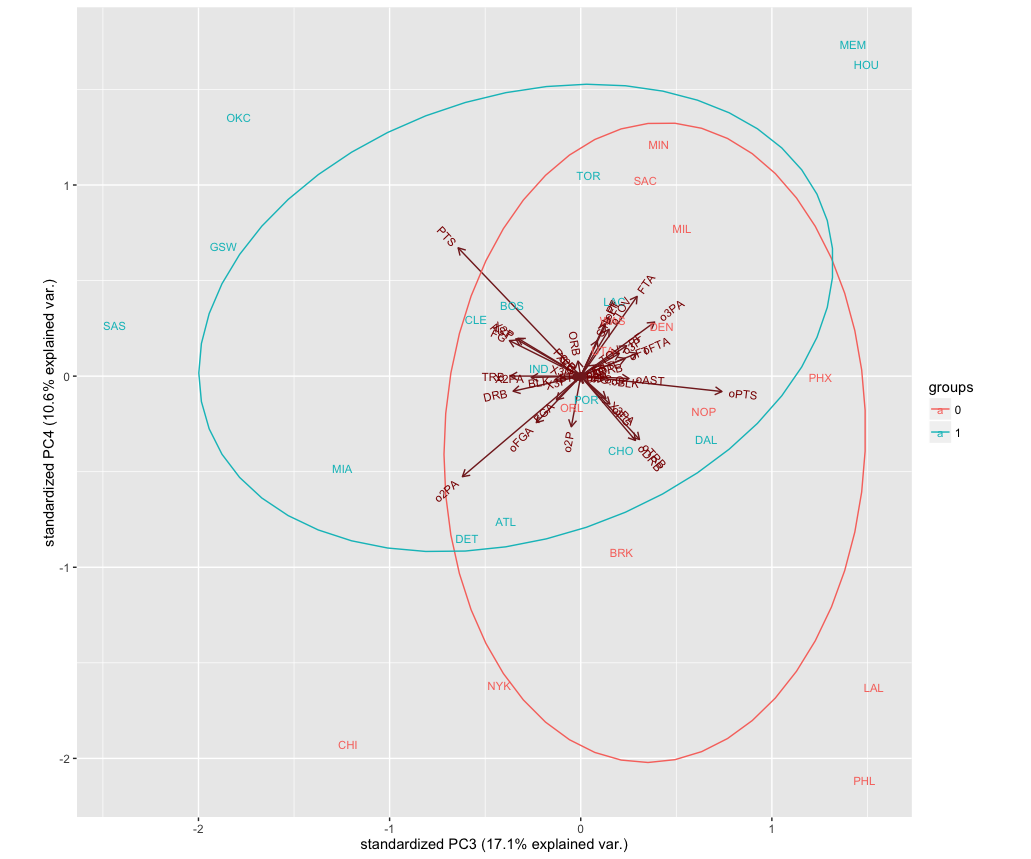
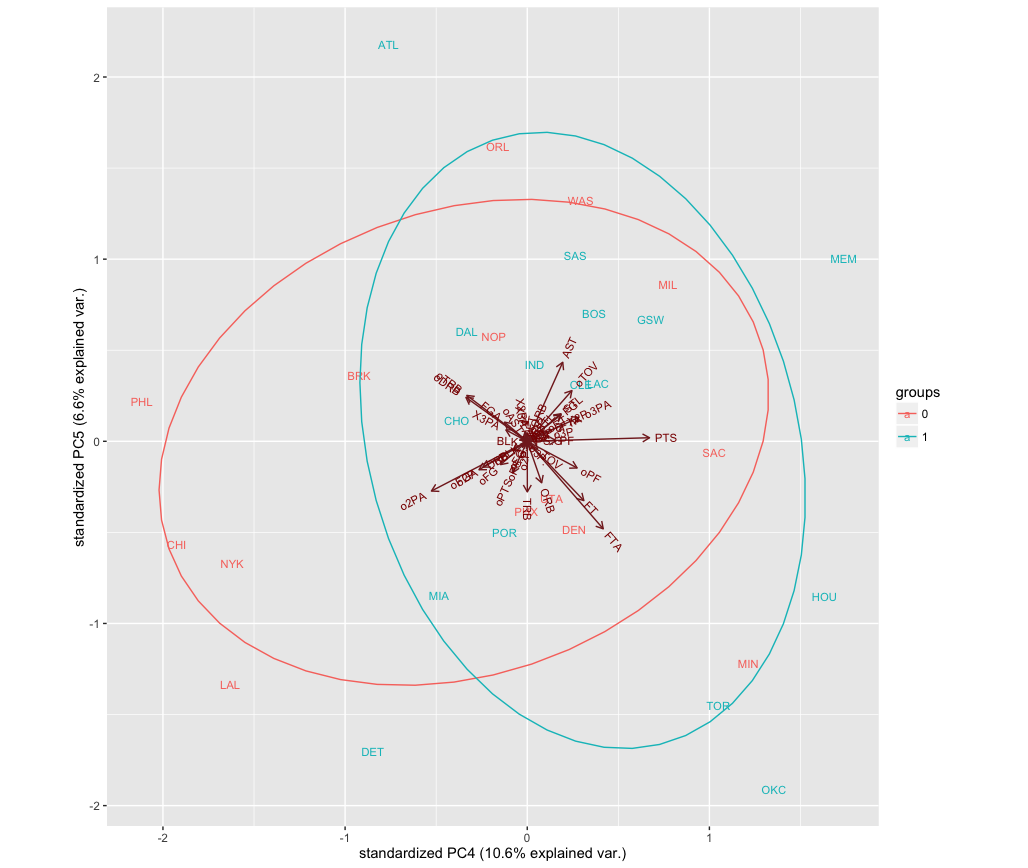
Here are the various biplots:
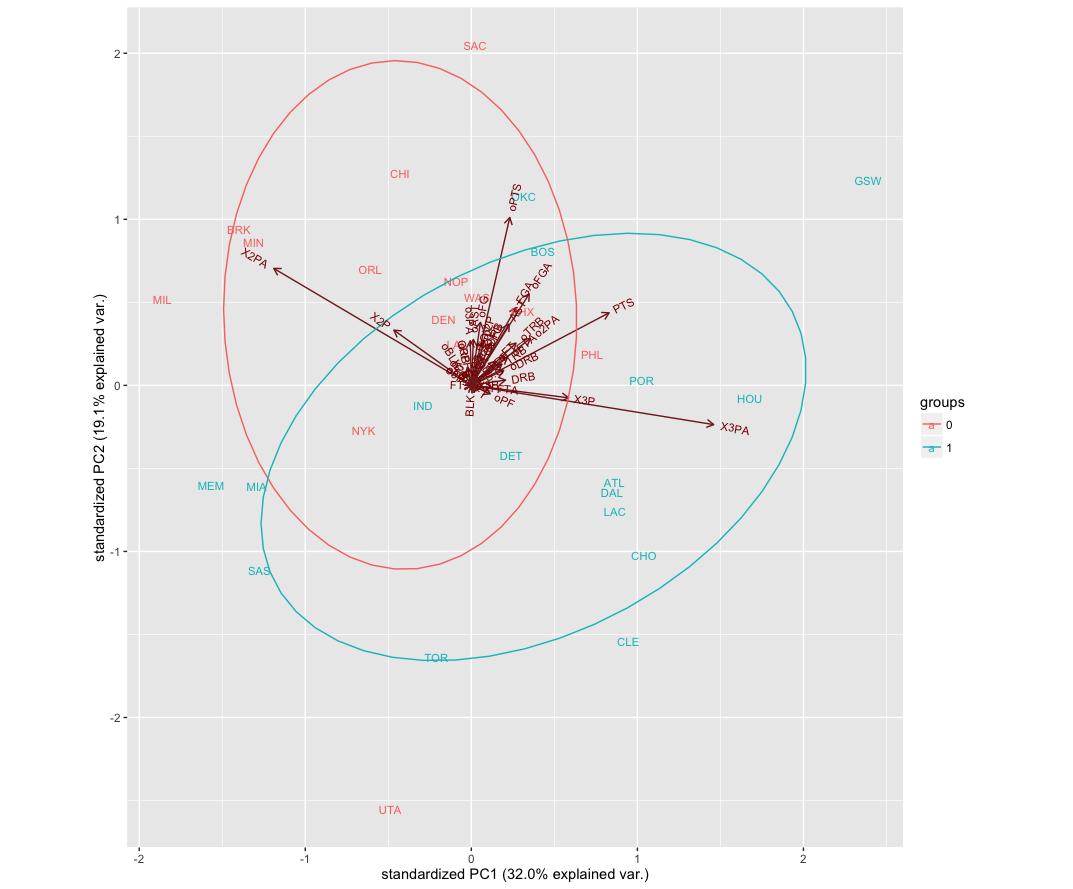
In these plots, the teams are grouped according to whether they made the playoffs or not.
One sees from this biplot of the first two principal components that the dominant component along the first PC is 3 point attempts, while the dominant component along the second PC is opponent points. CLE and TOR have a high negative score along the second PC indicating a strong defensive performance. Indeed, one suspects that the final separating factor that led CLE to the championship was their defensive play as opposed to 3-point shooting which all-in-all didn’t do GSW any favours. This is in line with some of my previous analyses.