The first thing to note is that just by looking at Basketball-Reference.com there are 62 factors that uniquely classify a team: MP FG FGA FG% 3P 3PA 3P% 2P 2PA 2P% FT FTA FT% ORB DRB TRB AST STL BLK TOV PF PTS OMP OFG OFGA OFG% O3P O3PA O3P% O2P O2PA O2P% OFT OFTA OFT% OORB ODRB OTRB OAST OSTL OBLK OTOV OPF OPTS PW PL MOV SOS SRS ORtg DRtg Pace FTr 3PAr eFG% TOV% ORB% FT/FGA eFG% TOV% DRB% FT/FGA, where OFGA indicates a given team’s opponent’s FGA per game average for a specific season.
The reason it is not meaningful to look at a specific statistic or a pair of statistics such as “three-point attempt rate” is that,

Because of this, what is required is a detailed statistic learning approach. I looked at the full season statistics for the last twenty NBA champions from the 1995-1996 Chicago Bulls to the 2014-2015 Golden State Warriors.
I employed principle compoent analysis (PCA) to reduce the number of dimensions to see which variables contribute most to the variance of the data set. I found that the first 7 of 20 principle compoents explained 88.52% of the variance. Therefore, we can effectively reduce the dimension of the data set from 63 to 7. This can be seen in the scree plot below:

A visualization of the 63-variable data set is as follows:


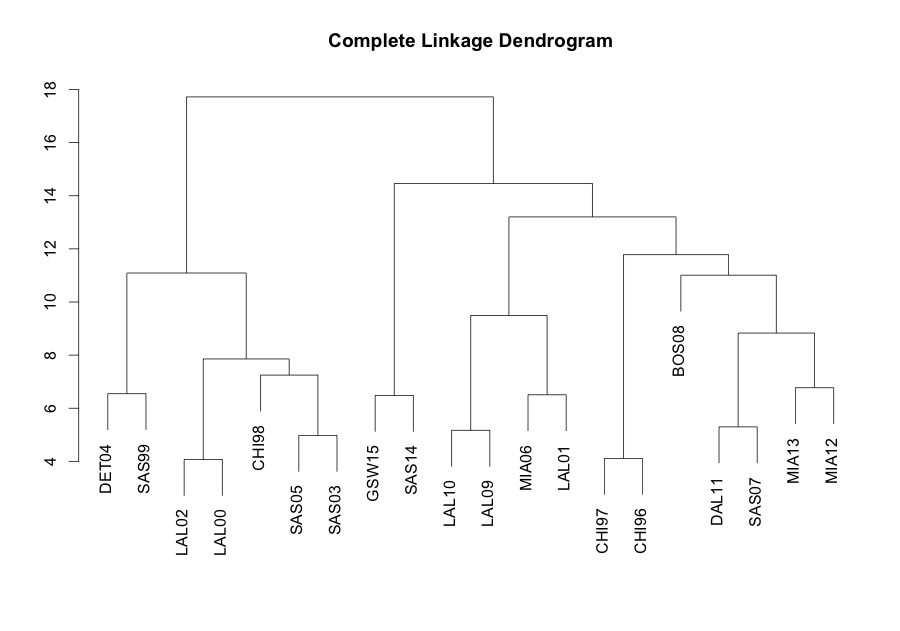
- The 2015 Golden State Warriors were very similar to the 2014 San Antonio Spurs.
- Not surprisingly, Phil Jackson’s 2000 and 2002 Lakers teams were very similar to each other but not to any other championship team, and similarly for his 2009 and 2010 Lakers teams.
- Interestingly, the two teams that stand out which are truly dissimilar to any other championship team are the 2008 Boston Celtics and the 1998 Chicago Bulls.
This analysis also eliminates the notion that a team has to play a specific style, for example “modern-day play” to win a championship. In principle, there are many possible ways and styles that lead to a championship and an analysis such as this deeply probing the data shows this to be the case.
