As usual, here is the post-game breakdown of Game 2 of the NBA Finals between Cleveland and Golden State. Using my live-tracking app to track the relevant factors (as explained in previous posts) here are the live-captured time series:

Computing the correlations between each time series above and the Golden State Warriors point difference, we obtain:
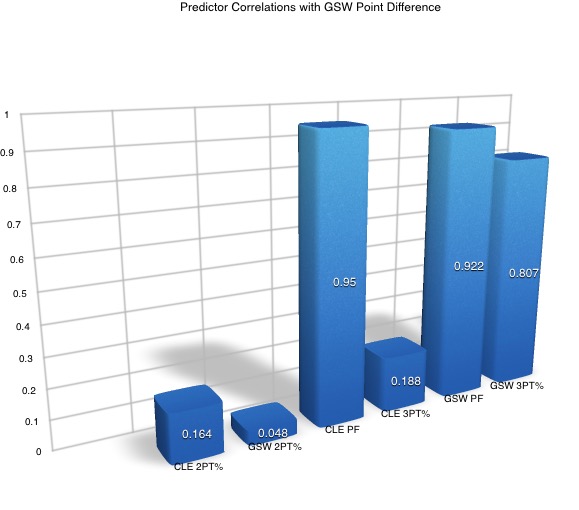
One sees once again that the most relevant factors to GSW’s point difference in the game was CLE’s personal fouls during the game, GSW’s personal fouls during the game, and not far behind, GSW 3-point percentage during the game. What is interesting is that one can see the importance of these variables played out in real time matching the two graphs above.
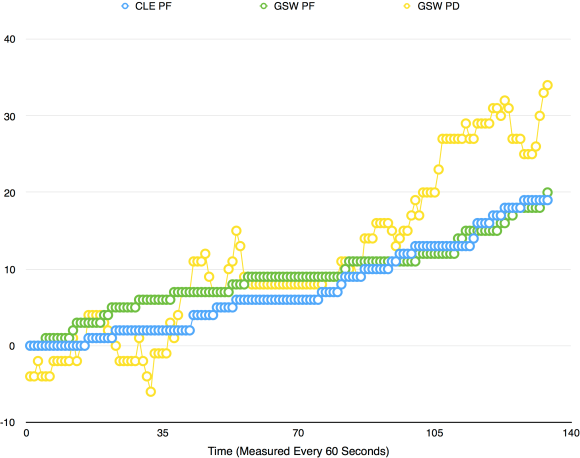
In fact, looking at the personal fouls vs. GSW point difference in real time (essentially taking a subset of the time series graph above), we obtain:

One reply on “Game 2 of CLE vs GSW Breakdown”
[…] a summary analysis of previous blog postings which tracked individual games. For example, here , here and a first attempt […]